aweSOM – Training and Visualizing Self-Organizing Maps in R
Dimensionality reduction is a powerful technique for making sense of high-dimensional data—and self-organizing maps (SOMs) are one of the more intuitive and visually appealing approaches in this space. After reading this paper, I became especially interested in how SOMs can be used to explore complex social and economic datasets.
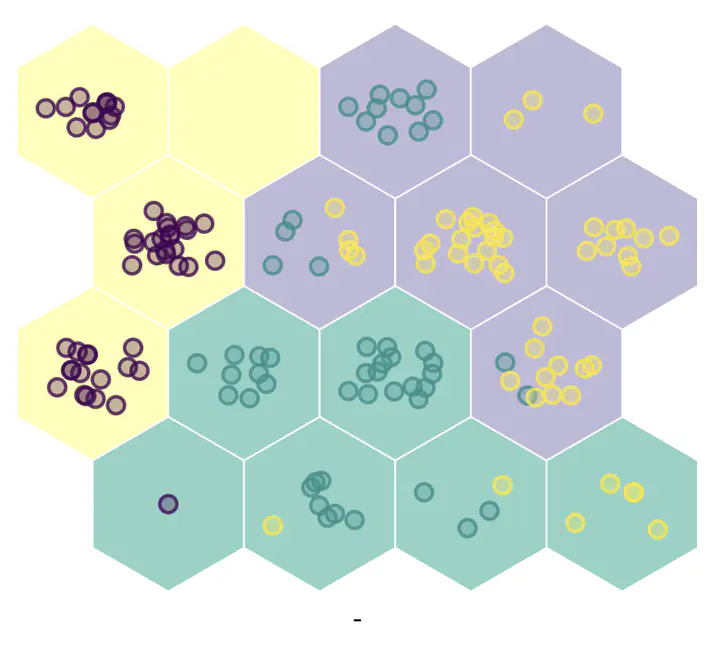
During a research internship at the Center for Research in Economics and Statistics (CREST) in France, I joined the development team of the aweSOM R package, which offers tools for training, evaluating, and visualizing SOMs. A key feature is its integrated Shiny App, allowing users to interactively explore model outputs.
My contributions included:
- Building JavaScript-based interactive visualizations for map interpretation.
- Refactoring and optimizing the R codebase for computing SOMs.
- Enhancing the usability and modularity of the app interface.
This work bridges machine learning, data visualization, and applied statistics—all in an accessible, open-source R package.